Monday, August 31, 2009

HH31 Spreadsheet

Hello and welcome to my blog.

This is not a recommendation to buy or sell any of the stocks discussed on this blog. Due diligence is your responsibility. If you need professional investment advice then find a professional.

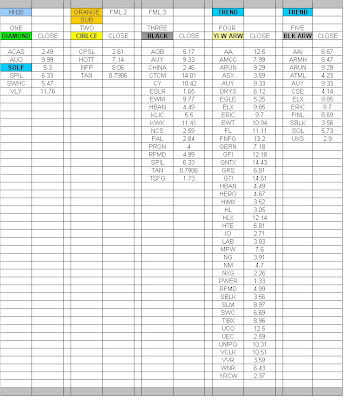
A very short table today. No highlights. I am too tired to even look. PCBC would come off the watch list since it is now below the 3 horizontal lines. Only by a tad though. Will have to see if it re-signals. Everything else seems okay but a little iffy in places. Only ETFC stands out as being fairly good.

Thank you for your time.

Saturday, August 29, 2009

HH28 Spreadsheet

Hello and welcome to my blog.

This is not a recommendation to buy or sell any of the stocks discussed on this blog. Due diligence is your responsibility. If you need professional investment advice then find a professional.

Table below. A lot of entries for yellow line cross, no new highlights. SOLF is a changed column entry.

Thank you for your time.

Thursday, August 27, 2009

HH27 Spreadsheet

Hello and welcome to my blog.

This is not a recommendation to buy or sell any of the stocks discussed on this blog. Due diligence is your responsibility. If you need professional investment advice then find a professional.

The table is below with no highlights. ETFC is a changed column entry. All of the stocks seem to be hanging in there okay.

In the next couple of days I will try and explain using stops when a stock moves into a blue trend phase. This is basically when price is above the 18 day exponential moving average. Of note HW has done this in the last few days. It really becomes using a trailing stop when the trend phase becomes clear. More later.

Tired and a also a little angry about my day job. Grumble, the life of a 'pee on' is never fun and never rewarding or gratifying. Enough said. More sleep and a good weekend to look forward to.

Thank you for your time.

Wednesday, August 26, 2009

HH26 Spreadsheet

Hello and welcome to my blog.

This is not a recommendation to buy or sell any of the stocks discussed on this blog. Due diligence is your responsibility. If you need professional investment advice then find a professional.

Too tired to even think. GSAT is a move up a column repeat. The picks seem to be doing okay.

Thank you for your time.


Tuesday, August 25, 2009

HH25 Spreadsheet

Hello and welcome to my blog.

This is not a recommendation to buy or sell any of the stocks discussed on this blog. Due diligence is your responsibility. If you need professional investment advice then find a professional.

Table below. See if I can make it a little less fuzzy. Not that many entries and one new highlighted stock. SOLF.

The GIGM entry is a move into the yellow arrow trend column and UTSI is a move into the black arrow trend column. Both of these are on the watch list. UTSI is the one playing with threes' and has bumped into 1.80.

All of the others I am following seem to be doing okay. I am a little worried since I feel the general market is a little toppy. Have to see what the future brings.

Thank you for your time.


Monday, August 24, 2009

HH24 Spreadsheet

Hello and welcome to my blog.

This is not a recommendation to buy or sell any of the stocks discussed on this blog. Due diligence is your responsibility. If you need professional investment advice then find a professional.

The table is below with a small change. A new column has been added and the yellow circle indicator is now giving signals after doing a work around. Two new highlighted stocks to watch, EGLE and WNR, see how they do. The other nine are still doing okay and right now I just remembered that I should have done a weekend summary list. Oh well, pretty tired so maybe later. Besides, no changes.

Thank you for your time.

Sunday, August 23, 2009

HH23 MetaStock 3 Lines Code plus ONB chart

Hello and welcome to my blog.

This is not a recommendation to buy or sell any of the stocks discussed on this blog. Due diligence is your responsibility. If you need professional investment advice then find a professional.

The following are the three codes I am using. I can not take credit for any of this work. They are taken from the MetaStock forum and the MetaTools site. At the MetaStock forum search for Darvas Box and start reading and drilling down.

I would like to thank all of the people that did all the hard work that I am using. The next time I go surfing I will find the proper names and places. The following has also been tweaked for my own use so they do not match the originals. Sorry if I made a mess of the orignals.

Thank you for your time.

Thick Black Line: HA. Html does not like the less than, greater than symbols. Change red words to symbols.

LL: equal If(LOW equal LLV(LOW,6),LOW,
If(Ref(LOW,-1) less than LLV(LOW,6),Ref(LOW,-1),
If(Ref(LOW,-2) less than LLV(LOW,6),Ref(LOW,-2),
If(Ref(LOW,-3) less than LLV(LOW,6),Ref(LOW,-3),
If(Ref(LOW,-4) less than LLV(LOW,6),Ref(LOW,-4),
If(Ref(LOW,-5) less than LLV(LOW,6),Ref(LOW,-5),0))))));
NL: equal ValueWhen(1,LOW less than Ref(LLV(LOW,6),-1),LOW);
box1: equal LLV(LOW,3) greater than LLV(LOW,4);
box2: equal ValueWhen(1,BarsSince(LOW less than Ref(LLV(LOW,6),-1))
equal 3 AND box1 equal true,NL);
box3: equal ValueWhen(1,BarsSince(LOW less than Ref(LLV(LOW,6),-1))
equal 3 AND box1 equal true,LL);
TopBox: equal box2;
BottomBox: equal box3;
TopBox: equal box2;
{BottomBox: equal box3;}
TopBox;
{BottomBox;}

Yellow Line:


Lt:=If(Cross(HHV(H,4)=Ref(H,-3),.9)=1,L,PREV);
Bot:=If(Lt less than Ref(Lt,-1),Lt,PREV);
Bot


Thin Black Line:

If(Cross(HHV(H,9)=Ref(H,-8),.9)=1,L,PREV)


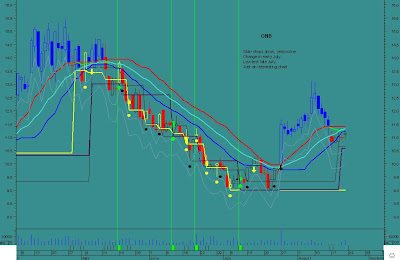
I thought the yellow line stair step down was interesting and possibly instructive in the following chart. Signals then stops a few times, then signal no stop. The low test held at the matched lines and gee, a nine.


HH23 Explain eg: EZPW, F

Hello and welcome to my blog.

This is not a recommendation to buy or sell any of the stocks discussed on this blog. Due diligence is your responsibility. If you need professional investment advice then find a professional.

After my post yesterday I kept thinking about how to clarify the information presented here. Want "simple, but not too simple." It finally came down to three sideways and three trend.

When price is moving sideways there are three lines that will be important. The thick black one, the thin black one, and the yellow one. These three rely on a low during the look back period. Added to this are the less 5% and less 10% price levels. These are hard if you will and always relate to the present day price, being used as a reference versus a signal.

A signal is generated when price crosses from below any of the three lines. Then it is a matter of deciding if a sensible stop point can be established using any of the lines. This is a cop-out but the chart will just look right. It should look like it has an inherent sound structure. Quiet looking, not noisy. Even when I read this I think 'boy what a crock'. However, it is necessary to just have faith in what looks and feels right.

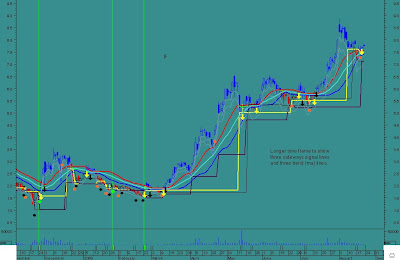
One structure to look for is a small spread between the three lines. For me at least the narrow spread provides a higher level of confidence. As well matched or tight lines can be extended and may possibly provide a reference point in the future. This feature is marked on the chart of EZPW.

The other three lines are all related to trend and are based on an 18 day exponential moving average. There is a little bit of tweaking involved but just a basic moving average works. This signal is simply a cross of price from below. Nothing fancy and shows up as a blue price bar on the charts. Moving back below the moving average may signal an exit. This will depend on whether the three sideways are still relevant or not. Generally if it is at the start of an up move then they will be important, if the up move is established then they are not.

Once again I feel that this explanation is fuzzy and I apologize. The following charts are EZPW and F. I hope they clarify a little better what I am trying to explain here. I will also post the MetaStock formulas that I am using in another post. That way you can play along at home if you want.

Thank you for your time.


Saturday, August 22, 2009

HH22 Reasons

Hello and welcome to my blog.

This is not a recommendation to buy or sell any of the stocks discussed on this blog. Due diligence is your responsibility. If you need professional investment advice then find a professional.

I am still fighting a little with the MetaStock software and that is frustrating. In some ways I am just fighting with myself but that is another story.

When I think about trying to explain how I use the signal information it gets kind of muddled. Yes it makes sense to me but without a ton of words and charts it takes some time to convey the thought process. Anyways, perhaps if I just give the basic skeleton the fleshy nuances can be worked out later.

Here goes. The basic principle is to use recent lows as points of reference. Call it a Darvas Box bottom or whatever, it is just recent lows. The look back time tends to be six, nine, or eighteen days. Love the three's and nine's. Once the established low is crossed a signal is generated. Depending on the time frame, indicator used, a graphic will show up on the chart.

The first signal usually generated shows up as a green line with or without a green diamond. The basis of this signal is price crossing the thicker black line. When this occurs it is time to examine the chart to decide which phase the stock is in. Accumulation, uptrend, distribution, downtrend. Looking mostly for accumulation or early uptrend positioning. Next it is a matter of determining whether a logical stop point can be set.
It is all about defence.

The points I look at to enter a stop are basically the recent low points. These are the three horizontal lines on the chart. Thick black (this is where the signal came from), thin black and yellow. A cluster of these three tends to reinforce the level as a stop point. The other two points looked at are a 5% and 10% level below the signal day close. These are the two white lines.

The intention is to find a point that says the signal was wrong and it is time to get out and move on. You do not want to lose a lot while testing the waters.

The above applies only to when a signal is generated by price crossing the thick black line. This is the major one of the three horizontal lines. The other two horizontal lines use a similar method of determining stop levels when they generate signals.

Another set of criteria is applied if the signal comes from the moving average trend indicator. For now I think this is confusing enough so I will not go into any more explanations today. The following chart is of COMS and will hopefully clarify the words. The two areas of interest are highlighted.

Thank you for your time.


Friday, August 21, 2009

HH21 Spreadsheet

Hello and welcome to my blog.

This is not a recommendation to buy or sell any of the stocks discussed on this blog. Due diligence is your responsibility. If you need professional investment advice then find a professional.

Another long list of signals, but again no new highlights. However, four of the nine have shown up with confirming signals. ETFC, FCF, PCBC and UTSI. Means at least they are moving in the right direction.

I figured out a work around for the signals in the two column. Not exactly want I wanted but good enough. I am not in the frame of mind to be always climbing the MetaStock learning curve. Too bad there is not a sort of MetaStock lite. Also a little annoyed since I clicked a wrong button and now have to redo some work. Groan, oh well.

I will try tomorrow to start posting the charts of the signalled stocks with brief explanations.

Thank you for your time.

HH21 Teresa Lo Site

Hello and welcome to my blog.

A couple of days ago I posted a chart by Justin Mamis concerning sentiment. It is from his book, The Nature of Risk. A very nice summary has been done by Teresa Lo on her site. Here is the link: http://www.invivoanalytics.com/2007/12/07/the-sentiment-cycle/ There is also a great deal of other stuff there and it is well worth clicking around and doing some reading.

The following is taken from the link above.

quote

Yes, a good trading system helps us stay the course and do the right thing. It prevents us from chasing performance, from loading the boat at the top. A good trading system does not allow us to experience the trauma of puking at the bottom after a long downtrend by virtue of using stops and position sizing. A good trading system frees us from our worst fears - the fear of losing, and the fear of missing out.

Buying high and selling low is not the way to go, but human nature makes it hard to resist doing it because we are simply designed to feel most confident and have the most conviction to act when there is a massive amount of public opinion that concurs with the fundamentals, along with widespread agreement that a big trend in place. Contrarians tend to be way too early, and often experience the old "light at the end of the tunnel is the on-coming train" phenomenon. By and large the typical human "gut" is simply not geared for trading.

We tend to worry too much about making the trade at hand work out for us as if we want bragging rights or something. Let’s not forget that each trade is inconsequential in the big picture (unless every trade is a loser!), since the goal is to make as much money - over a reasonably long run - with as little risk as possible. If you don’t believe me, read the papers at SSRN on Prospect Theory. One of the best ones was The Diversification Puzzle by Meir Statman.

Because each of us we will conduct many transactions over the course of a lifetime, we can’t get worked up about every single one of them. Some will make money; some will lose money, but if I know that my approach is correct and my methodology is sound, then the only thing I need to do with the trade in front of me is make sure that it will not be the one to put me out of business.
We have to keep the ball moving toward the end zone, but we can’t go for the 90-yard "only in the movies" touchdown attempt every time. Most often, the hardworking team grinds it out play by play - a few steps forward, one step back. Always be defensive. Recover those fumbles.

end quote

Thank you Teresa Lo.

Thank you for your time.

Thursday, August 20, 2009

HH20 Spreadsheet

Hello and welcome to my blog.

This is not a recommendation to buy or sell any of the stocks discussed on this blog. Due diligence is your responsibility. If you need professional investment advice then find a professional.

A very long list of signals today. Despite this only a couple of highlighted entries. Both of these are also repeats. UTSI and ETFC.

Such a long list makes me wonder what is going to happen. Continuations or failures? Have to wait and see.

For now a list of nine is enough to keep an eye on. All of these seem to be doing alright so far, no blow outs at least. The nine are: COMS, ETFC, FCF, GIGM, GSAT, HW, PCBC, UTSI, ZSL.

Thank you for your time.

Sorry for fuzzy. Click to enlarge.

Wednesday, August 19, 2009

HH19 Spreadsheet

Hello and welcome to my blog.

This is not a recommendation to buy or sell any of the stocks discussed on this blog. Due diligence is your responsibility. If you need professional investment advice then find a professional.

The table of scan results is below. Again a fair number of yellow arrow signals. None are highlighted. Only one highlight. GIGM. Watch and see how it develops.

A total of nine stocks now being watched closely. Over the weekend I should be able to put up a chart of each one with a small outline giving the reasons for why I think they are of interest.

Thank you for your time.

Tuesday, August 18, 2009

HH18 Sentiment Cycle + Phases

Hello and welcome to my blog.

The following chart is to give an example of how I try to look at the markets. It is from one of the books by Justin Mamis. It is over layed by the ideas presented by Stan Wienstien in his book. I will look up and provide proper names later. The Mamis concept is also discussed on a website by Teresa Lo. This I will also reference later.

The reason I present this chart is to give an idea of how I cull out the picks from the scans that I do. The four phases of the market are accumulation, uptrend, distribution, and downtrend. These are labeled on the chart. Interesting that they are almost the opposite of the sentiment that is being expressed in these areas.

Basically what I look for are signals on stocks in the accumulation phase or ones at the start of the uptrend phase. As always, easy to say but often hard to identify. What may look like accumulation may be a pause in a continuing down move. Or what looks like distribution may be a pause in a continuing up move.

From these choices I then look to see if a reasonable stop can be placed. I am too tired to get into the details of this as they are cooking but not fully done. Soon, I promise.

For now the chart.

Thank you for your time.


HH18 Spreadsheet

Hello and welcome to my blog.

This is not a recommendation to buy or sell any of the stocks discussed on this blog. Due diligence is your responsibility. If you need professional investment advice then find a professional.

The table for today is below. The number of yellow arrow entries is large but none of them looked promising so no highlights there. ETFC which was taken off the list is back on today. It moved back above the Darvas Box Low. The other highlighted entry is FCF.

I have to go back into MetaStock and tinker a little bit since I see signals on a couple of the charts for the two yellow circle alert. These do not show up on the scans though so something is amiss. Not now though. Too tired.

Thank you for your time.


Monday, August 17, 2009

HH17 PCBC 3

Hello and welcome to my blog.

This is not a recommendation to buy or sell any of the stocks discussed on this blog. Due diligence is your responsibility. If you need professional investment advice then find a professional.

Another look at PCBC. Getting very close to a stop out point. The blue line is at 2.44 and would be the hard runaway point. To be more generous and given it is a three I would use 2.40 as a stop point. If that happens I would still continue to monitor the stock to see if it can move back up above the moving average. This would reset the blue uptrend price bar. Can only wait and see what happens.

Thank you for your time.


HH17 Spreadsheet

Hello and welcome to my blog.

This is not a recommendation to buy or sell any of the stocks discussed on this blog. Due diligence is your responsibility. If you need professional investment advice then find a professional.

The table for today is below. Only three entries and none are highlighted. So, nothing to say.


Thank you for your time.

HH17 Last Weeks Picks

Hello and welcome to my blog.

This is not a recommendation to buy or sell any of the stocks discussed on this blog. Due diligence is your responsibility. If you need professional investment advice then find a professional.

I must have been thinking of something else or the dog ate the cheque that is in the mail. The following table is a summary of the signals from last week.

Given the market down move today only one has been taken off the list. This is ETFC. The reason for its' removal was a down move below the Darvas box low. I will keep an eye on it over the next few days to see if it can muster a recovery. Want to see a move above the moving averages and back to a blue trend color.

All of the others remain on the list but are testing areas that say runaway. Time ran out this weekend for providing details of the stop levels I plan to use and I hope to provide those in the next week.

Thank you for your time.


Sunday, August 16, 2009

HH16 Look Back :(

Hello and welcome to my blog.

This is not a recommendation to buy or sell any of the stocks discussed on this blog. Due diligence is your responsibility. If you need professional investment advice then find a professional.

When I returned to using StockFetcher last month I created a small watch list in an attempt to monitor the daily scan results more closely. I have done a bad job with the updating and only this weekend returned to look at the list. The following was created for July 06, 2009. OUCH. The table shows the entry and current price along with the percentage net change.


I am trying not to beat myself up too much when I look at this. Not easy.

I will forgive myself easily for making mistakes. I will easily move on to new opportunities. I will easily continue to learn, evolve and adapt. These things allow me to be a successful trader.

I can console myself by thinking that my scan method produced some good results. After that it is time to move on. It is now time to learn, evolve and adapt. Time to review the above and then look for current opportunities. Time to look at the present and not the past.

Thank you for your time.

The chart of ZLC. Time to learn and not bemoan.


Thursday, August 13, 2009

HH13 UTSI (Three's)

Hello and welcome to my blog.

This is not a recommendation to buy or sell any of the stocks discussed on this blog. Due diligence is your responsibility. If you need professional investment advice then find a professional.

UTSI chart. More a curiosity but actually warming up to the chart. The levels are marked on the chart with each number divisible by 3. The 1.575 is the half way point between 1.35 and 1.80. See what the future brings. Love the three's and nine's.

I would also like to again express my deep thanks to Dongoro for originally posting the concept of three's and nine's on his web site. I am sorry to say that the site is no longer available and I do not know how to contact him. Thank you Dongoro.

Thank you for your time.

HH13 Spreadsheet

Hello and welcome to my blog.

This is not a recommendation to buy or sell any of the stocks discussed on this blog. Due diligence is your responsibility. If you need professional investment advice then find a professional.

Only one stock highlighted, UTSI. The only reason this one will get some attention is the number 3. Yep, a magic number. A channel shape bounded by 1.80 at the top and 1.35 at the bottom. This puts 1.575 as the middle. For the last month the price has been in the top half of the larger channel above 1.575. More out of curiosity than anything else I plan to watch what happens. I will do a separate post with the chart to give the visuals.

For now the table. Fuzzy so click to enlarge.

Thank you for your time.


Wednesday, August 12, 2009

HH12 Spreadsheet

Hello and welcome to my blog.

This is not a recommendation to buy or sell any of the stocks discussed on this blog. Due diligence is your responsibility. If you need professional investment advice then find a professional.

Still smiling about how easy it is to post a table of the scan results. There are two new stocks that are greened and I plan to keep an eye on them over the next little while. When I find the time I will outline why certain ones get picked for closer attention while others are discarded.

So far I am happy about using this new way of doing things. Will have to see how I feel about the changes in a couple of weeks or so.

Thank you for your time.

Tuesday, August 11, 2009

HH11 PCBC 2

Hello and welcome to my blog.

This is not a recommendation to buy or sell any of the stocks discussed on this blog. Due diligence is your responsibility. If you need professional investment advice then find a professional.

Just an update. Despite being down a lot today I still like the way this chart looks. Would set a stop and re-evaluate at 2.44. This is the blue line. Going down through this would mean keeping an eye out for the 2.00 - 2.08 level, the most recent low area.

There is just something about the channel on this chart that is appealing. Will continue to monitor and see what happens.

Thank you for your time.

HH11 Spreadsheet

Hello and welcome to my blog.

This is not a recommendation to buy or sell any of the stocks discussed on this blog. Due diligence is your responsibility. If you need professional investment advice then find a professional.

Only ZSL caught my eye. The only reason it got attention is that it is near a low set in June. See what happens.

The photo software I am using to easily post these tables is by: http://www.serif.com/ Thank you Serif.

Thank you for your time.

HH11 Gambling Risk

Hello and welcome to my blog.

"There are two great pleasures in gambling: that of winning and that of losing."

This quote crossed my path twice recently. Perhaps a coincident, perhaps not. Anyways, it reminded me that it is the pleasure of the game that matters and not the final outcome. The act of taking on a stock position should be a pleasant experience. If it is not a pleasant experience than perhaps something is wrong.

To use the old catch phrase: Plan the trade. Trade the plan. With any plan the risk levels must be set before entry. Always determine the exit strategy before entry. So, if the trade goes against you then you are out before any major damage takes place. You take a chance and play, you lose, but you followed your plan, so you move on and look for the next opportunity. Take pleasure in playing the game because the next time may be a winner.

Thank you for your time.

Monday, August 10, 2009

HH10 Dang SpreadSheets

Hello and welcome to my blog.

This is not a recommendation to buy or sell any of the stocks discussed on this blog. Due diligence is your responsibility. If you need professional investment advice then find a professional.

I am going to try and just paste the scan results onto this blog. I am tired of doing things twice by using google docs. As always just end up with a list. DANG, and I thought it might have changed.

HA. Found the solution. Make the spreadsheet a picture and upload. Shaking head and grinning to self at such an easy solution. Golly.

For today only a couple catch my eye. GSAT and HW, highlighted in green.


I will explain the signal headings in a later post. If you go back to the PCBC entry from yesterday you can see them on the chart along with some stop levels. I will get around to further explanations in a couple of days or so.

Thank you for your time.

HH10 PCBC

Hello and welcome to my blog.

This is not a recommendation to buy or sell any of the stocks discussed on this blog. Due diligence is your responsibility. If you need professional investment advice then find a professional.

Just a quick chart of PCBC. I finally worked out a rough outline for the scans to use in determining candidates for trade consideration. The one that caught my eye was PCBC.
I plan to monitor this stock over the next week.


Thank you for your time.

Sunday, August 9, 2009

HH09 RESTART 2

Hello and welcome to my blog.

I wanted to edit the first post of today but got cut off by technical difficulties.

The MISSION STATEMENT in the previous post still stands and my course correction has started. New and improved is on the way.

Thank you for your time.

HH09 RESTART

Hello and welcome to my blog.

The past few weeks have been spent gettin lost inside the little box. Learning curves, charts, too much, too little, this way, that way. In the last little while the inherent uncertainties of the markets have flowed into my own brain. A world filled with maybes and what-ifs. Instead of guiding my ship through the sea I have let the sea toss me around like a cork. Not a good thing.
Now is the time to take hold of the tiller and steer my own course.

While surfing the net and practicing avoidance behavior I came across the following forum thread. http://sites.google.com/site/stratsstressfreetrading/

You can go and read the whole thread if you like but the following few lines are what I came away with.

quote
I am a professional trader. My job is to take risk. If I manage my losses and let my profits run I will be successful. Because I am a professional trader, I will forgive myself easily for making mistakes and move on to new opportunities. I feel great that I have the discipline to control my emotions and the patience required to be a professional trader. I am a professional trader and will make $1,000,000 by year end. I will achieve this by following my trading plan, setting achievable goals, and controlling my emotions. I am confident and believe in my own ability to be consistently profitable because I AM a professional trader.

The first thing, after identifying a trade MUST ALWAYS BE - WHAT IS MY RISK?...
The ONLY thing they care about is how much they can LOSE. Amateurs and all other traders think just the opposite - how much can they make.

Here's a quote from the book, "Techniques of Tape Reading" , by Vadym Graifer and Christopher Schumacher - "Professionals take a trade when they are comfortable with the risk, while amateurs do it when they like the potential profit."

Buy when it goes up and sell when it goes down.

I trade TO LIVE, the losers LIVE to trade.
unquote

I have modified the first section to become my own mission statement. A way to rebuild my own confidence and get hold of the tiller and back on course.

MISSION STATEMENT

I am a successful trader.
My job is to manage risk.
I will cut my losses and let my profits run.
I will forgive myself easily for making mistakes.
I will easily move on to new opportunities.
I will easily continue to learn, evolve and adapt.
These things allow me to be a successful trader.

I feel great because I have the discipline to control my emotions.
I feel great because I have the ability to be a successful trader.
I am a successful trader and will make $1,000,000 by year end.

I will achieve this goal by following my trading plan.
I will achieve this goal by setting achievable goals.
I will achieve this goal by controlling my emotions.
I am confident and believe in my own ability to be consistently profitable.
I AM a successful trader.