Wednesday, September 30, 2009

II30 Spreadsheet

Hello and welcome to my blog.

This is not a recommendation to buy or sell any of the stocks discussed on this blog. Due diligence is your responsibility. If you need professional investment advice then find a professional.

Table below. Very few entries.

OCLS would be stopped out at 2.45. Proved wrong. Will continue to keep an eye. Post mortem later.

Thank you for your time.


Tuesday, September 29, 2009

II29 Spreadsheet

Hello and welcome to my blog.

This is not a recommendation to buy or sell any of the stocks discussed on this blog. Due diligence is your responsibility. If you need professional investment advice then find a professional.

Table below. Just the list with no highlights. There will be some changes to the presentation in the next couple of weeks. Suffering from a bit of MetaStock and Excel burnout. Still need to work out an easier scan and a couple of other things. Jello still not set.

Q which is in the green diamond column all by itself and looks interesting. Will start to keep an eye but not a full monitor. OCLS made a low today of 2.46 which was one penny above the stop. Oy. Can not get any closer. Oy. Wrong until proven correct. Feeling wrong in a wrong way right now. See what tomorrow brings.

Thank you for your time.


Monday, September 28, 2009

II28 Spreadsheet

Hello and welcome to my blog.

This is not a recommendation to buy or sell any of the stocks discussed on this blog. Due diligence is your responsibility. If you need professional investment advice then find a professional.

Table below with a lot of entries and a small change. I am going to stop adding the full list to the one posted here. So it will just be the stocks with signals. I am also going to change a couple of other things in the next week or so to incorporate the Slope indicator. Right now though just a basic table. Have a lot on my plate and a lot of changes to be made. The bus is being tuned up a little bit and I am have to get used to the added basic mechanics.

One new entry into the stocks I am watching. OCLS. It gave a slope signal and looks okay. Have to see what happens. I also worked out a trade sheet for this one which means some added work.

Thank you for your time.


Sunday, September 27, 2009

II27 Climbing and Changing MA slope ALU chart

Hello and welcome to my blog.

This is not a recommendation to buy or sell any of the stocks discussed on this blog. Due diligence is your responsibility. If you need professional investment advice then find a professional.

I thought of the title 'Digging Holes' for this entry but figured that climbing and changing was more positive.

A few days ago in the library I noticed the book "Sell and Sell Short" by Elder. From his book I picked up a few ideas that I figured I could incorporate. The first was his calendar idea and using Outlook to track trades. Not exactly the format I wanted but the thought had been planted. The final result is the calendar format I presented a couple of days ago. Something I am happy with.

The other idea I picked up was the 2% money (risk) management concept. Although I already had something similar in place I got busy and formalized the concept. The idea became reality as another page in a spreadsheet. Very easy to create and grounded is better than floating. Now it is easy to just open the page and find the reference.

The final idea I picked up was his use of the slope of the moving averages. An idea I had toyed with before but never really pursued. Well, the last few days I have been looking into using the moving average slope as an indicator. Time to get out the crayons and throw more parts at the bus. So far I am pleased with my results. Right now though I am sitting with new stuff sloshing around in my brain waiting for the jello to gel.

Since I use 4 varieties of a moving average I took the slope of each of these and then took the average of this result. This seemed good as a trend indicator when it crossed from below to above 0. However it is a few days slower than the slope of the 18 day moving average. Given this lag I ended up using the faster 18 day moving average. The intention is to use the crossing of 0 as another entry signal and the slower one for confirmation. The confirming (lagged) signal also works well with the other trend signal I use. So the end result is the faster indicator has been added to the signals I am already using and the look so far seems promising. The major change is that it eliminates more of the early (false) signals which were showing up before.

With just the preliminary parts in place and only a cursory look at the charts I think it is worth keeping the slope indicator in place. The slightly larger time lag is compensated by the increase in confidence.

The next few weeks of real time will be the final decider of whether these added indicators are kept or not. Will just have to wait and see.

The chart of ALU follows. This has been used as an example in earlier posts. The gold price bars are when the slope indicator is above 0. These actually show up prior to the full ALL CLEAR signal during July. The jello is still hardening. The green line in the top pane is a histogram line of the slope indicator, the black histogram bar in the same pane is the moving average trend confirmation indicator.

Thank you Doctor Elder for the seeds.

Thank you for your time.

Saturday, September 26, 2009

II26 Watch List Table

Hello and welcome to my blog.

This is not a recommendation to buy or sell any of the stocks discussed on this blog. Due diligence is your responsibility. If you need professional investment advice then find a professional.

For awhile I have been looking for a way to track the stocks I have an interest in. Through a couple of chance encounters I think I have found the solution. The result is the table below. Some of the details still need to be worked out but a good frame now exists. Clear records are important to clear thinking. The bus just cleared another bump.

Thank you for your time.

II26 SPX Chart Signal

Hello and welcome to my blog.

This is not a recommendation to buy or sell any of the stocks discussed on this blog. Due diligence is your responsibility. If you need professional investment advice then find a professional.

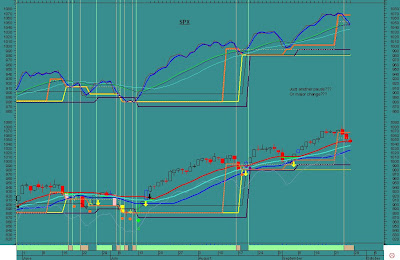
SPX chart with signal. It is still above the moving averages and the confirming signal at the top of the chart remains positive. However, the move below Orange does give rise to some concern. This may possibly be just another pause in the up move similar to late June/early July, as well as the mid August pause. See what the future brings.

Thank you for your time.


II25 Spreadsheet

Hello and welcome to my blog.

This is not a recommendation to buy or sell any of the stocks discussed on this blog. Due diligence is your responsibility. If you need professional investment advice then find a professional.

Table below. There are a lot of entries in the Orange column and with so many I did not provide the non ALL CLEAR list. One reason for the large amount is that the Orange is really a surrogate for one of the other Darvas Box bottoms. There would be a lot less if I culled out the anomalies by hand. Another reason for the large amount is that the Orange has moved from above the price to below the price. I do not think this is a good omen. It is a whole different story if the price moves from below a horizontal Darvas Box bottom to above it.

More and more my gut says that the last little while has been a distribution phase. This means that fewer candidates should show up on the scan lists. Evidence of this is in another record that I started keeping. This record is a sum of the signals of the total list of stocks I have in the scan. This is only a couple of weeks old so it is hard to say whether it will be of any use. Will have to wait until more data points are entered. However in the last couple of weeks the number of stocks giving a Black Arrow signal has dropped from 542 to 283 out of a total of 588. The Black Arrow is a basic longer trend indicator with the average price over the average/average. The other indicators are also showing similar drops and I plan to work on some graphs to get a visual of these.

As well as the drop in the number of positive aspect stocks, the SPX moved below the Orange a couple of days ago. I will post the chart later. This may just be a pause since the other major indices are still positive and have not signaled. It still makes me think that at least for now it is better to exercise a lot of caution regarding any entry signals given for individual stocks.

A few of the stocks on the watch list are still doing okay although it is getting thinner. I finally worked out a spreadsheet I am happy with to improve record keeping. I will provide this in another post. I have a couple of new things on the go again so please have patience as the bus continues to head down the road. Adapt to the changes and learn as you go. The ride is getting smoother despite feeling like going over a cliff at times.

Thank you for your time.


Thursday, September 24, 2009

II24 Spreadsheet

Hello and welcome to my blog.

This is not a recommendation to buy or sell any of the stocks discussed on this blog. Due diligence is your responsibility. If you need professional investment advice then find a professional.

Table below. Hardly any entries. No highlights.

EGLE off list with move below orange horizontal, SOLF back off list again with move below orange horizontal. Others not looking that pretty with the exception of COMS.

Update review this weekend.

Thank you for your time.


Wednesday, September 23, 2009

II23 Spreadsheet

Hello and welcome to my blog.

This is not a recommendation to buy or sell any of the stocks discussed on this blog. Due diligence is your responsibility. If you need professional investment advice then find a professional.

Table below. UTSI with an orange sell signal. This is the three stock so will continue to watch. Possible test down to long sideways pattern. SOLF out, in, on the edge. HW back in but on the edge. Will do a full review over the weekend.

Thank you for your time.

Tuesday, September 22, 2009

II22 Spreadsheet

Hello and welcome to my blog.

This is not a recommendation to buy or sell any of the stocks discussed on this blog. Due diligence is your responsibility. If you need professional investment advice then find a professional.

Table below. SOLF is back on the list with an ALL CLEAR today. Forgot to highlight it. Will wait to see how it does. A little late and a little tired so I will give a list update tomorrow. Everything looks okay.

Thank you for your time.


Monday, September 21, 2009

II21 Spreadsheet

Hello and welcome to my blog.

This is not a recommendation to buy or sell any of the stocks discussed on this blog. Due diligence is your responsibility. If you need professional investment advice then find a professional.

The new format for the table is below. I highlighted the ones that are ALL CLEAR. Maybe this will make them easier to see. These are stocks that have moved above all of the DARVAS BOX bottoms. None of the entries seemed to warrant further attention.

All of the stocks on the list I am watching are doing okay. The only one that was missed as an opportunity was WNR, taken off the list and now has moved up. Shrug. Will re-post the list tomorrow.

HW which came off the list last week, showed up today with a move above the orange horizontal. It has not moved into the ALL CLEAR list though. Will have to watch to see if it can make it onto the ALL CLEAR list in the near future. I do like the looks of this chart but right now there is no signal. Have to wait and see what the future brings.

Thank you for your time.


Sunday, September 20, 2009

II20 ALU chart revisited

Hello and welcome to my blog.

This is not a recommendation to buy or sell any of the stocks discussed on this blog. Due diligence is your responsibility. If you need professional investment advice then find a professional.

In the post of II07 I presented ALU as an example of using the clearing of all the DARVAS BOX bottoms as a possible entry signal. ALU is presented again but with a revised chart format. Almost the same but a little more fleshed out, an ALL CLEAR signal is now more distinct. This ALL CLEAR signal is now presented in the revised spreadsheet which I post daily.

In the earlier example I also looked at how the solid orange horizontal line could possibly be used as an exit point. An exit based on this criteria took place but was followed almost immediately by an ALL CLEAR entry signal. In this case an entry stop would have been placed at the dotted DARVAS BOX bottoms since these have the closest proximity.

So far the stock has performed alright. Remember though to "think wrong until proven correct".

Thank you for your time.

II20 Spreadsheet REVISION II18

Hello and welcome to my blog.

This is not a recommendation to buy or sell any of the stocks discussed on this blog. Due diligence is your responsibility. If you need professional investment advice then find a professional.

Ch..ch..ch..Changes. Once again a change. The table below is a revised version of how I will present the spreadsheet information. The intention is to eliminate the early (false) signals from the system. The columns labelled ALL CLEAR are the ones to focus on. The columns labelled FULL LIST are a reference to the complete list of signalled stocks. This is not the list to focus on but there may be something of interest there. Note that column 1 has no entries in the ALL CLEAR section, but 3 entries in the FULL LIST section.

The reason for this revision is that too many early (false) signals were being generated. This new method is designed to pick out only the stocks that have cleared all of the DARVAS BOX bottoms, not just the individual DARVAS BOX bottoms.

Please remember that even though a stock is on the ALL CLEAR list it does not mean there is an automatic entry. I still go through the list and try and figure out what looks good. These I will highlight if I decide the stock is worth further consideration.

If an entry is made the DARVAS BOX bottom with the closest proximity is used as a stop loss. If a trend becomes established then other stop criteria are used. I will expand on stop points in a later post.

Thank you for your time.


Saturday, September 19, 2009

II19 ALVR chart

Hello and welcome to my blog.

This is not a recommendation to buy or sell any of the stocks discussed on this blog. Due diligence is your responsibility. If you need professional investment advice then find a professional.

Chart of ALVR. The original post of this chart is II08. Done okay so far. This update adds a trend ribbon (at the bottom) for the Darvas Bottom indicators, as well as a trend tick at the top of the chart. The trend tick being a confirming signal only.

Thank you for your time.


II18 Spreadsheet

Hello and welcome to my blog.

This is not a recommendation to buy or sell any of the stocks discussed on this blog. Due diligence is your responsibility. If you need professional investment advice then find a professional.

Table below. Another day with only a few entries. No highlights. I have worked out another MetaStock chart expert which displays when the price has moved above all of the Darvas low horizontal lines. As well I have added a moving average trend indicator. Both of these are just more visual aides. As always the hope is to clarify and not confuse. I will provide an example chart in another post.

Thank you for your time.


Thursday, September 17, 2009

II17 Spreadsheet

Hello and welcome to my blog.

This is not a recommendation to buy or sell any of the stocks discussed on this blog. Due diligence is your responsibility. If you need professional investment advice then find a professional.

Table below. Very few entries with no highlights.

HW moves out of the list I am watching with a move below the orange horizontal. Will keep an eye though to see if it makes a successful test and then re-breaks up to the upside. Pop up in UTSI the three oddity stock.

Thank you for your time.


Wednesday, September 16, 2009

II16 Spreadsheet

Hello and welcome to my blog.

This is not a recommendation to buy or sell any of the stocks discussed on this blog. Due diligence is your responsibility. If you need professional investment advice then find a professional.

Table below.

Thank you for your time.


Tuesday, September 15, 2009

II15 Spreadsheet

Hello and welcome to my blog.

This is not a recommendation to buy or sell any of the stocks discussed on this blog. Due diligence is your responsibility. If you need professional investment advice then find a professional.

Table below, no review, no highlights, nothing new. List still doing okay.

Thank you for your time.


Monday, September 14, 2009

II14 Spreadsheet

Hello and welcome to my blog.

This is not a recommendation to buy or sell any of the stocks discussed on this blog. Due diligence is your responsibility. If you need professional investment advice then find a professional.

Table below with a fairly small number of entries. No review done so no highlights.

Did a quick run through of the list I am following. A Coles notes review follows.

ALVR, newest entry. Doing okay. Close @ 4.27. Raise stop from 3.74 to 3.85.
COMS, okay, possible pullback.
EGLE, okay.
ETFC, okay. Near recent high level.
FCF, out.
GIGM, okay, but at orange line.
GSAT, okay, long term dish. Handle test maybe. No trend.
HW, okay, possible pullback.
PCBC, still out.
SOLF, out.
UTSI, curiosity of threes. Pennant, flag formation?
WNR, out.
ZSL, out. Silver short world. Well below a couple of the horizontals to negate other entry signals.

Thank you for your time.

Saturday, September 12, 2009

II11 Spreadsheet

Hello and welcome to my blog.

This is not a recommendation to buy or sell any of the stocks discussed on this blog. Due diligence is your responsibility. If you need professional investment advice then find a professional.

The table is below. Weekend and lazy so no new highlights even though the list is smaller than recent entries. I am somewhat satisfied with the current list and have a close watch on ALVR.

Thank you for your time.

Thursday, September 10, 2009

II10 Spreadsheet

Hello and welcome to my blog.

This is not a recommendation to buy or sell any of the stocks discussed on this blog. Due diligence is your responsibility. If you need professional investment advice then find a professional.

The table is below. Increase in the number of black arrow trend entries. No hard looks done since I really feel like watching the football game instead. So no highlights or much else.

COMS up again today. Reminder again of keeping your own council. The new entry of ALVR is up a tad today. Maintain the assumption of wrong until proven correct.

Thank you for your time.

Wednesday, September 9, 2009

II09 Spreadsheet

Hello and welcome to my blog.

This is not a recommendation to buy or sell any of the stocks discussed on this blog. Due diligence is your responsibility. If you need professional investment advice then find a professional.

The table is below. Not nearly as many entries as yesterday but quit a few just the same. I have not done any review of the table since I can not get into the groove right now. One stock of note is COMS. I took this off the list a couple of days ago and boom, today it pops upwards in price. One of the reasons it got dumped was a negative post from someone else regarding COMS. This set a bug in my brain and I just kept thinking they were right and I was wrong. A lesson to always remember to do your own work and follow your own council. Ah well.

Thank you for your time.


Tuesday, September 8, 2009

II08 ALVR (new)

Hello and welcome to my blog.

This is not a recommendation to buy or sell any of the stocks discussed on this blog. Due diligence is your responsibility. If you need professional investment advice then find a professional.

Chart of ALVR. New on the list by clearing all the box bottoms. Stop set at orange line.

"Assume wrong until proven correct." The quote is from Phantom of the Pits. This is a PDF file available on line, just google the name. Glad I found this surfing the other day and I remember reading it years ago. Some lessons and things need to be rediscovered to value there wealth. Thank you Phantom.

Thank you for your time.


II08 Spreadsheet

Hello and welcome to my blog.

This is not a recommendation to buy or sell any of the stocks discussed on this blog. Due diligence is your responsibility. If you need professional investment advice then find a professional.

Stocks gone wild or indicators gone wild. A heck of a lot of entries in the table. Only a couple of highlights since I do not have the time to scroll through them all. This is one of the disappointments I have with MetaStock, no slide show capabilities. Would love to just sit back and watch the charts flip by. Maybe lazy but I get tired of clicking sometimes.

On the list I am watching COMS is now out. The others seems to be doing okay with HW as my favorite. Of interest is SOLF, it was on the list, then off, then back on a couple of days ago as a pay attention stock. Biggish move up today. See how it does since if I used the criteria outlined yesterday (clearing all box bottoms) it would not be on a watch list.

A new one on the list is ALVR. Cleared all the box bottoms and can set a stop with the orange horizontal. Will post a chart in a separate entry.

At the moment my efforts here may seem scattered but I feel that it is all starting to come together in terms of a, hate to use the word, system. Please remember that I have a real job that keeps me busy and a girlfriend that I love very much. Both take a lot of my time as I try and drive this bus down a bumpy road. Thank you for your patience.

Thank you for your time.

Monday, September 7, 2009

II07 NutShell or NutJob ALU chart.

Hello and welcome to my blog.

This is not a recommendation to buy or sell any of the stocks discussed on this blog. Due diligence is your responsibility. If you need professional investment advice then find a professional.

With the new column added this weekend the total of Darvas Bottom formulas now stands at six. I think this is probably more than enough. Each seems to be independent enough and they cover a range of time frames.

I am not using Darvas Box stuff in the usual manner but instead am using the box bottom only to look for entry signals. If price is below the box bottom and then moves above the box bottom a signal is generated. Without all the noise it is essentially buying when there is a move above recent lows. A stop loss can be placed either just below or at the box bottom which generated the signal.

After looking through a number of charts with all those lines on them it seems that it is best to wait for a series of signals. One by itself may be alright, but once all of the box bottoms have been cleared the signal seems to be stronger. A chart example of ALU follows. Yes, it is cherry picked as an illustration and there are many times that this situation does not work out. I still think though that it is a pattern worth looking for in the future.

The other potential to explore is to use a penetration below the heavy orange line in the top panel as an exit from a position. You decide: Nutshell or Nut job?

Thank you for your time.

Sunday, September 6, 2009

II06 Another Column Added

Hello and welcome to my blog.

This is not a recommendation to buy or sell any of the stocks discussed on this blog. Due diligence is your responsibility. If you need professional investment advice then find a professional.

I was looking for a way to fix the surrogate indicator being used for one of the Darvas Box Bottoms. Not happy since the one used is time consuming since it does not scan properly using the MetaStock Explorer. Instead of finding a solution I came across another formula for a Darvas Box. For now I will use this new found indicator and then work on fixing the other problem. At first glance this new one seems okay and I will have to spend some time looking it over. This post is just to see how the table fits with the added column.

Fits okay. Fuzzy but just click to enlarge in new window.

Thank you for your time.


Saturday, September 5, 2009

II04 Spreadsheet

Hello and welcome to my blog.

This is not a recommendation to buy or sell any of the stocks discussed on this blog. Due diligence is your responsibility. If you need professional investment advice then find a professional.

Not much time this morning. The table is below and I have not had the time to edit. This means that some of the yellow (orange) circle entries may not be valid. The surrogate scan is okay but takes time to edit. Anyways, a lot of other entries to keep me busy.

Only a couple of stocks really stick out in my view from this past week. HW because I like the way it is looking and performing, and UTSI because it is a curiosity.

I will try and post some charts later if I find the time.

Thank you for your time.

Thursday, September 3, 2009

II03 Spreadsheet

Hello and welcome to my blog.

This is not a recommendation to buy or sell any of the stocks discussed on this blog. Due diligence is your responsibility. If you need professional investment advice then find a professional.

No changes in the list of watched stocks. Pop up with UTSI which was being watched because of the threes. Longish list of yellow trend arrows but no highlights.

Realised a couple of days ago that ZSL is the ultra short silver etf. Hmm, would rather play the long side with precious metals. Anyways, take a look at SLV for an almost opposite chart. May be a good idea to watch both for possible signals in either one. Maybe some charts over the long weekend which really starts about now.

Thank you for your time.

Wednesday, September 2, 2009

II02 Spreadsheet

Hello and welcome to my blog.

This is not a recommendation to buy or sell any of the stocks discussed on this blog. Due diligence is your responsibility. If you need professional investment advice then find a professional.

Short post because it is late. PCBC, SOLF, WNR get a pale highlight by crossing above the yellow horizontal. Yep, they just came off the list yesterday. See how well they behave in the next couple of days. All the others left on the list are hanging at the edge. See how they behave.

Thank you for your time.

Tuesday, September 1, 2009

II01 Spreadsheet

Hello and welcome to my blog.

This is not a recommendation to buy or sell any of the stocks discussed on this blog. Due diligence is your responsibility. If you need professional investment advice then find a professional.

Ouch. Down goes the Market. On a curiosity note the high on the Dow a couple of days ago was 9666 in round numbers. A nine number. Love the threes and nines. Just a curiosity since there are no magic numbers.

The list that I am following took a hit with three stocks getting the boot. SOLF, WNR, ZSL. Will keep an eye to see if they re-signal but it feels like stormy weather for the next couple of days. The others that remain on the list are very close to getting the boot and will just have to see what the future brings.

A couple of the list stocks I am more interested in because of patterns. GSAT with maybe a dish shape, and UTSI out of curiosity with the three numbers.

The table is below with no highlights.

Thank you for your time.